Measure and adjust
Plan vs. Actual Comparison
in projects
- Comparison per activity and work package
- Actual hours via interface
- Forecast across all projects

In short
A plan vs. actual comparison holds planned and actual project values against each other at a cut-off date: dates, effort and progress. Linetrack runs that comparison continuously per task and work package – progress from task tracking, actual hours imported from time recording – and carries the variance forward as a forecast across all projects. It is needed in three places: against the saved baseline, when evaluating scenarios, and in the post-calculation before archiving. In use at Schnaithmann Maschinenbau and LANG Technik, among others.



















50%
customers with an interface
import actual hours
56%
customers had a live connection
within the first 6 months
1512
projects managed
in parallel
100%
named a lack of transparency
as their starting problem
Every figure on this page comes from a full survey of all live Linetrack implementations, as of August 2026. Customers could name more than one starting problem.
Challenges
Why the plan vs. actual comparison usually arrives too late
100% of Linetrack customers named a lack of transparency as their starting problem, 91% Excel and tool chaos, 59% manual status chasing. Multiple answers were possible. In plan vs. actual work these patterns bite hardest – here are four of them.
The comparison only happens at reporting time
Plan and actual figures are pulled together when the monthly report is due. By then the deviation is four weeks old and the task in question is finished. What remains is an explanation, not a correction.


Planned hours and actual hours live apart
Planned values sit in the project plan, actual hours in time tracking, dates in a third list. 91% of customers named exactly this Excel and tool chaos as their starting problem. The comparison is then assembled by copy and paste – and is outdated again by the next booking day.
Progress is estimated, not reported
Without feedback at task level, percentage complete is an opinion. The classic case: a work package sits just short of done for weeks. Hours consumed and actual progress can no longer be checked against each other.
The deviation is documented, never extrapolated
The comparison shows a task took considerably more hours than planned. What that means for the delivery date and for the projects running in parallel is written down nowhere. 100% of customers named the missing portfolio view as their starting problem.
In practice
Three points in a project where the plan vs. actual comparison is drawn
Plan and resource plan on one side, feedback and actual hours on the other: the same comparison arises at three points, and at each one it answers a different question. The presentation is always the same – plan states sit on top of each other in the same bar chart, critical variances are red.
Project start and ongoing control
Plan versions: the original plan stays the yardstick
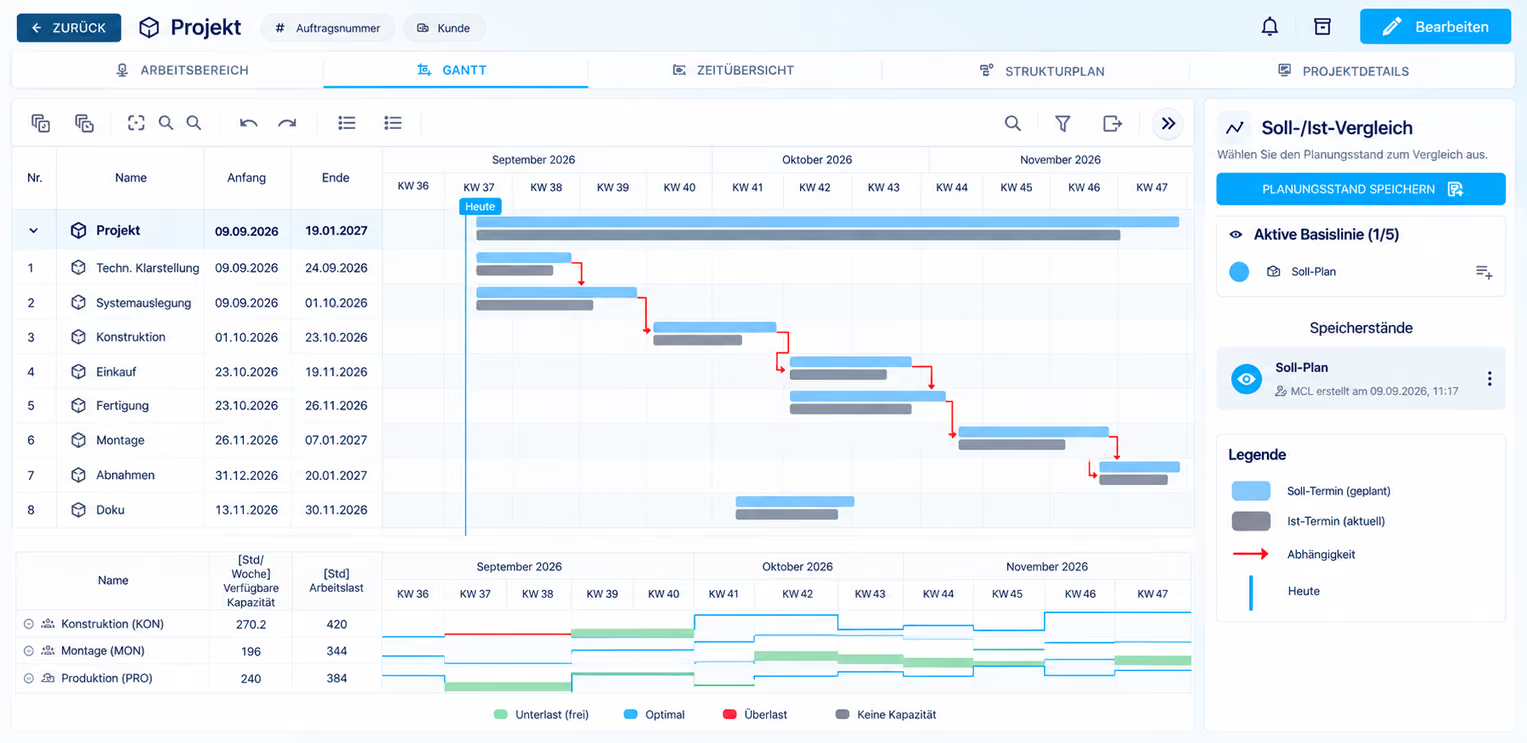
At project start the plan state is saved as a baseline. Every later replan creates a new state, and that state is the actual. In the bar chart both rows sit directly on top of each other: the target date from the baseline above the current actual date, per task.
Several plan states can be kept side by side and activated individually for comparison. That makes it readable how far a project has drifted from its first plan – and whether that came from a decision or crept in over twenty small shifts.
If a replan turns out to have been a mistake, you jump back to the earlier state: the plan is versioned, not overwritten. On the right of the image are the saved states, below them the utilisation of the departments involved – overload in red.
When something goes wrong
Scenarios: possible target states against the actual
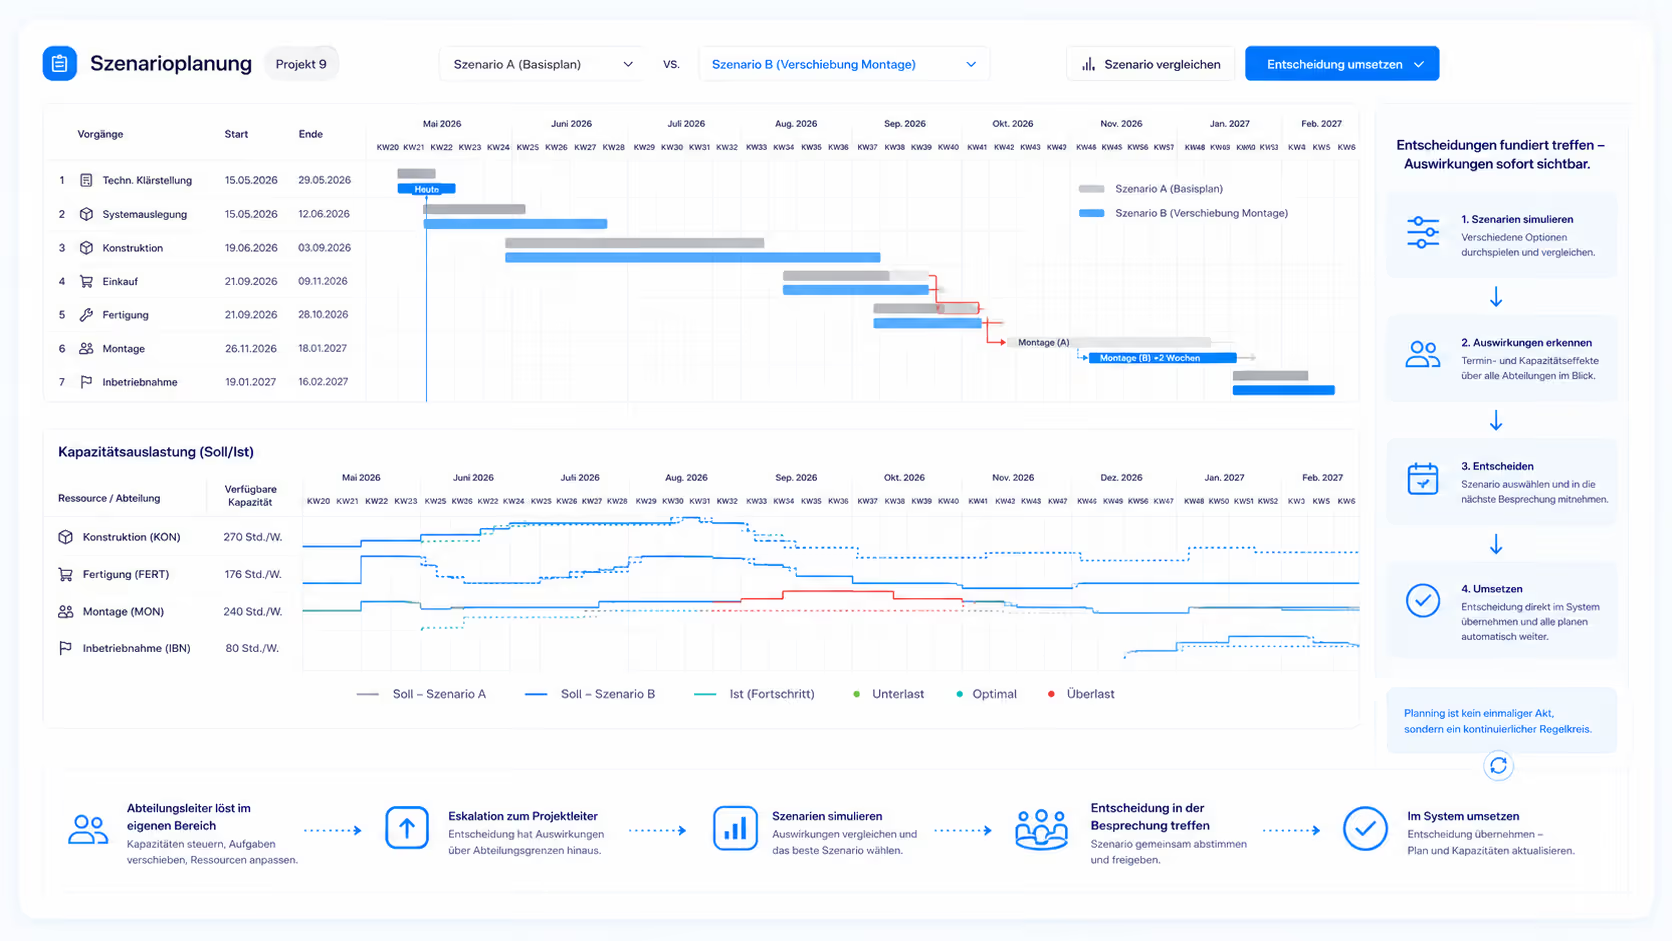
A possible solution is not written into the live plan but next to it. Hiring, outsourcing, moving tasks, running overtime or weekend shifts, shifting load to other teams: every variant is stored as its own scenario and keeps its own schedule and its own utilisation.
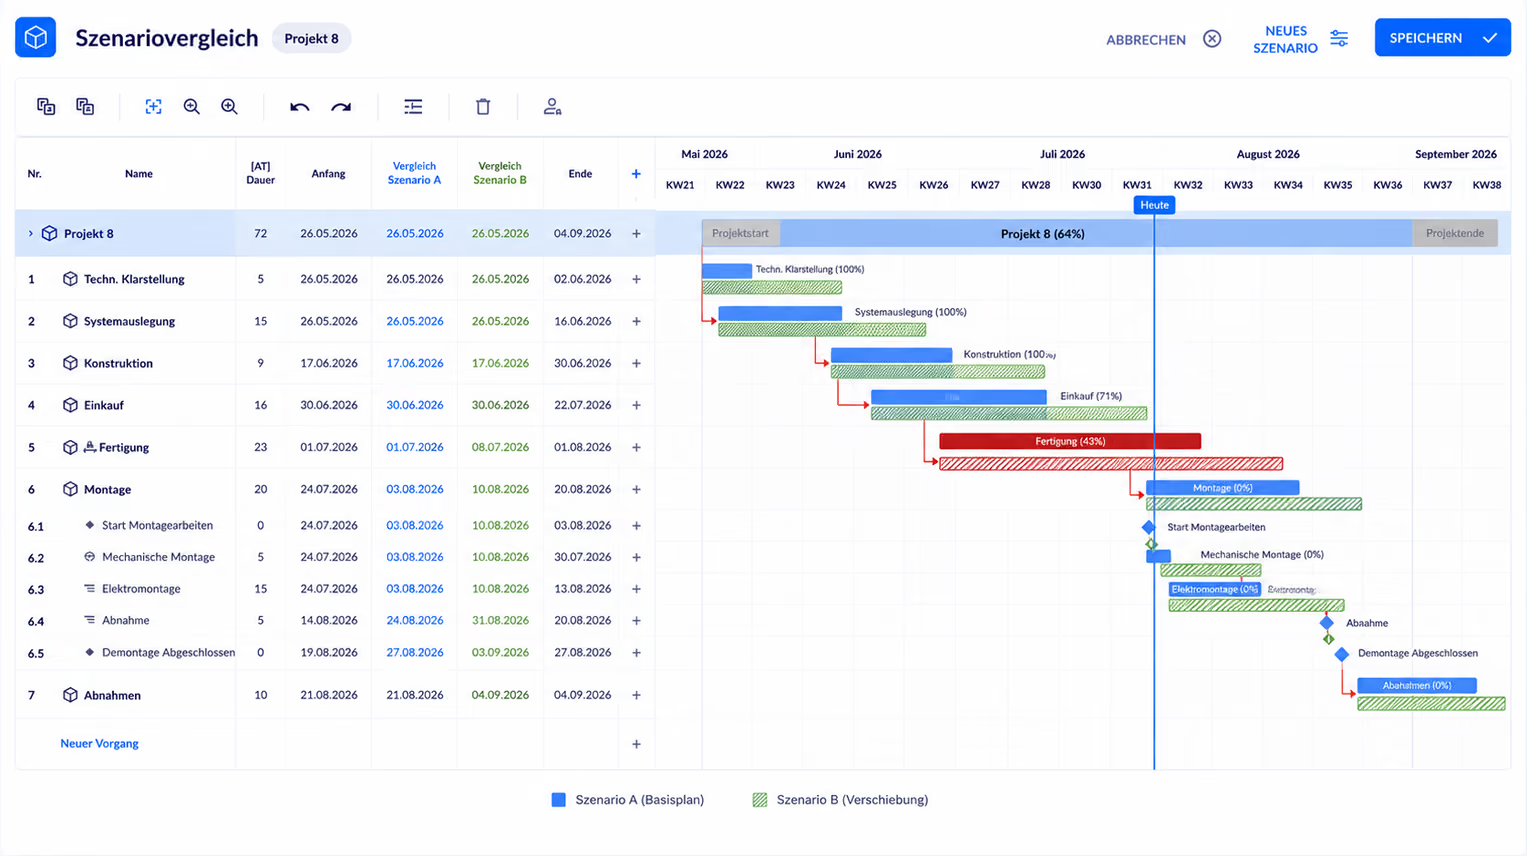
A scenario is therefore a possible target state held against the current actual state – what outsourcing does to the end date, what the extra shift buys, which other projects a reallocation hits.
In the image the baseline plan (scenario A) and the rescheduling (scenario B) sit on top of each other in the same bar chart, the comparison columns give the date per scenario, the red bar marks the task running out of plan. Because the variants stay side by side, the decision is a choice between calculated alternatives. What a shift triggers across the portfolio is covered under multi-project management.
Before archiving
Post-calculation: what the project gives the next one
The last comparison runs before a project is closed: original plan against actual course. How high the schedule adherence was, how well the calculated resources held, and where exactly the plan came apart.
The value shows up in the next quotation. If you know that commissioning ran over the calculation across several machines, you calculate the next one differently. Without this step the experience stays with the people who were there and leaves with the next change of staff.
All three rest on the same mechanism: a plan state against an actual state, at a cut-off date. What that means exactly and what has to be in place for it is covered in the sections that follow.
Definition
What is a plan vs. actual comparison in a project?
A plan vs. actual comparison in a project sets planned values against actual ones at a defined cut-off date – dates, effort and progress, per task, work package and project as a whole. The difference between the two series is the deviation. Its purpose is early warning rather than documentation: deviations should surface while the course can still be corrected.
The comparison needs three things: a plan as the yardstick, feedback for the actual value, and an assessment that leads to a decision. The plan is usually in place; the actual value is where it almost always falls short. That is why the next section looks at where it comes from. How planning, measuring and deciding fit together as a loop is described under project planning and control.
Where the actuals come from
Feedback instead of status chasing
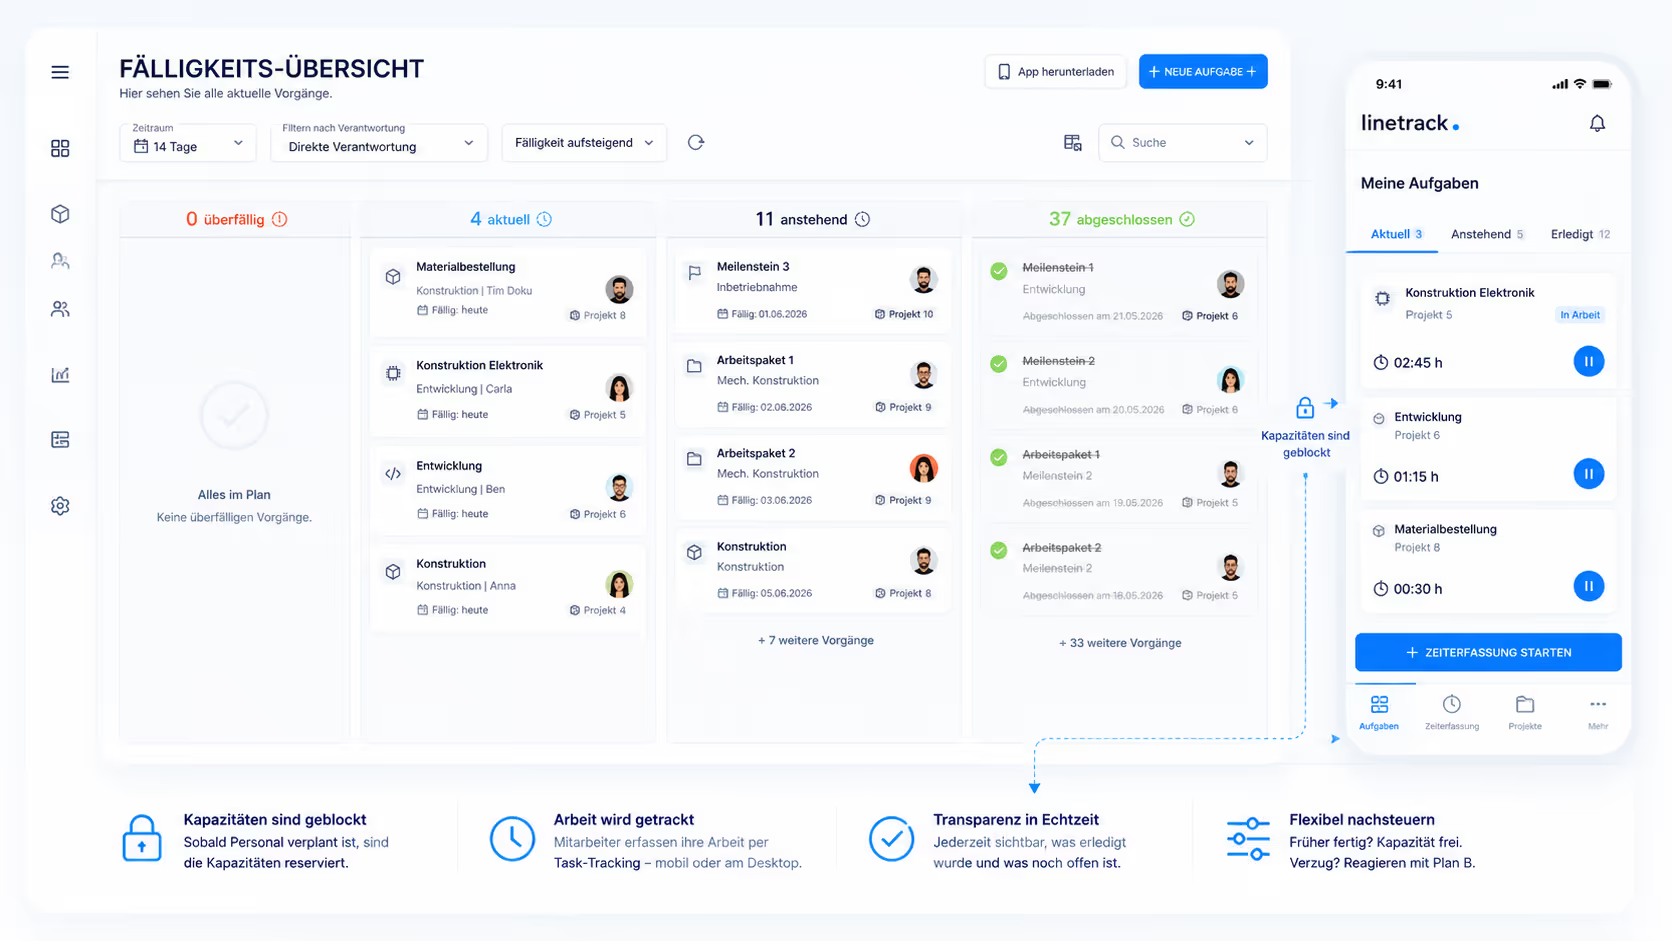
The actual status is created where the work happens. Employees report their tasks back through task tracking – design engineers on the desktop, fitters and field technicians on the mobile app. Progress is therefore not a collected figure from the weekly round, but a continuous data stream at task level.
59% of customers named manual status chasing as one of their starting problems, multiple answers possible – meaning the round of phone calls to every department before each meeting. Feedback in task management replaces exactly that step: the project manager does not ask for the status, they read it. The meeting then starts at the decision, not at data collection.
How far a task has drifted from the plan is visible directly in the bar chart; how tasks, dependencies and milestones are shown is described on the page about the Gantt chart. For the assessment, one simple rule has proven itself in practice: a variance that touches a milestone or a downstream task is decided immediately. Everything else is watched until the trend points the same way across two cut-off dates. That holds for dates and progress – for effort in hours, reliability depends on a second source.
An honest boundary
A plan vs. actual comparison is only as good as its actual data
The planned value is the easy half – it is in the plan. The actual value is the real hurdle. Progress and date status come from feedback inside the system, actual hours come from time tracking, purchase orders and invoices from the ERP. Each of those sources has to be connected, otherwise the comparison stays incomplete.
Concretely: 56% of Linetrack customers had a live connection running within their first six months. Of those, 50% use it to import actual hours for precisely this purpose, and 39% connected their ERP. Without connected time tracking, the effort comparison remains an estimate. Which systems are connected how is covered under integrations.
Linetrack does not record working time itself and is not an ERP system. That is deliberate: project control that brings its own time tracking competes with the system HR and the works council already run – and normally loses that contest. Linetrack reads the actual values instead of collecting them a second time.
Anyone without an interface is therefore well advised to start with dates and progress: these figures come out of feedback in the system and work without any connection at all. The hours comparison follows as soon as time recording is connected. A plan vs. actual comparison on half a data basis is more honest than one that invents actual hours from estimates. Once the data basis is in place, the comparison does not run once but as a fixed step in a loop that repeats.

Control loop
The plan vs. actual comparison is one step out of four
The planning system behind Linetrack has nine steps, from the sales forecast to the notification. The first five plan and track. The last four control, and they do not run once: they repeat as often as the project demands.
The plan vs. actual comparison sits at position seven. It measures what the preceding scenarios are worth and supplies the figure the corrective action rests on. Without the comparison, the action stays a guess. Without the notification afterwards, assembly never learns that it starts two weeks later. Once the round is done the loop starts again, with a new actual status and, where needed, new scenarios. The upstream steps are described under project control.
From hindsight to forecast
A plan vs. actual comparison looks backwards – the value comes from the forecast
A plan vs. actual comparison answers a question about the past: what was planned, and what happened? That is necessary, but it does not steer anything yet. The steering question is a different one: when will we finish on this trajectory – and which other projects does that hit?
That is why Linetrack carries the measured deviation forward. Hours consumed and reported progress produce a remaining effort, that effort is set against the department's remaining capacity, and the result is a new completion date. Because the same departments work across several projects, the shift becomes visible immediately in multi-project management – as a spike in the affected department's capacity histogram, not as a footnote in one project report.
The chosen variant goes back into the plan and becomes the new target for the next round – the point where the measurement turns into a yardstick again. How dates and capacities run together natively is described under scheduling and capacity planning in one system. Which figures fall out of each round is covered in the section below.
Metrics
Which metrics a plan vs. actual comparison delivers
A robust plan vs. actual comparison is not a single number but a set of metrics that answer different questions – and that come from different sources. The third column is the decisive one: it names the system that has to deliver the actual value before the metric exists at all.
Three of these six metrics – schedule adherence, percentage complete and milestone trend – come purely from data the project system produces itself. Effort, capacity utilization and outsourced cost depend on an interface. Starting without one gives you three reliable metrics and three estimates. That is a workable start – it just has to be called what it is.
Case Study
From recalculating to a running comparison
Before Linetrack, the plan vs. actual comparison was produced after the fact: planned hours from the project plan, actual hours from time tracking, merged into a spreadsheet whenever someone asked. Today the plan, the feedback and the actual hours run on one data foundation – the deviation sits in the same view as the plan, and the forecast carries it forward across every project.
„With Linetrack, we've eliminated countless opaque plans."


FAQ
Frequently asked questions
Still have questions?
Book a meeting with our team.
What is a plan vs. actual comparison in a project?
What is a plan vs. actual comparison in a project?
Which metrics belong in a plan vs. actual comparison?
Which metrics belong in a plan vs. actual comparison?
Where does the actual data for a plan vs. actual comparison come from?
Where does the actual data for a plan vs. actual comparison come from?
What is the difference between a plan vs. actual comparison and a forecast?
What is the difference between a plan vs. actual comparison and a forecast?
How often should a plan vs. actual comparison be run?
How often should a plan vs. actual comparison be run?
What is a baseline in a project plan?
What is a baseline in a project plan?
Which software is suitable for project monitoring and plan vs. actual comparison?
Which software is suitable for project monitoring and plan vs. actual comparison?
Learn more
Linetrack in detail
The modules behind plan vs. actual comparison, project monitoring and forecasting: