Plan and control
Project planning and control
in industrial projects

In short
Project planning and control describes the closed loop of planning, executing, measuring and adjusting: structure, dates and capacity are planned up front, and progress is measured against that plan continuously. Linetrack brings both steps onto one data foundation and surfaces deviations before they cost a delivery date – in use at Schnaithmann Maschinenbau and the STOLL Group, among others.










1512
projects managed
in parallel
400+
planning tools
replaced
4000+
completed
industrial projects
10WD
from kick-off
to go-live
Every figure on this page comes from a full survey of all live Linetrack implementations, as of August 2026.
Challenges
Why project plans lose their
meaning once work starts
100% of Linetrack customers named a lack of transparency as their starting problem, 91% named Excel and tool chaos, 59% named manual status chasing. Multiple answers were possible – on average 3.8 problems named at once per customer. Four patterns keep repeating.
The plan starts ageing on day one
The work breakdown structure is built once at kick-off and barely maintained afterwards. Four weeks in it no longer reflects reality – decisions are made on a document nobody keeps up to date.


The actual status arrives by phone call
59% of customers named manual status chasing as a starting problem: the project manager calls around the departments to find out where a task stands. By the time every answer is in, the picture is out of date again.
Plan and actuals sit in separate systems
Planned hours live in the project plan, actual hours in the time tracking system. Without a connection, the planned-versus-actual comparison is rebuilt once a month in a spreadsheet – far too late to steer the running project.
Adjusting without simulation is guesswork
When a task slips by two weeks, it is unclear which successor tasks and which parallel projects are affected. Without scenarios, the meeting estimates instead of calculating – and the effect only shows up in the next status report.
Definition
Planning and control: where they differ
Project control is the ongoing regulation of a project during execution: progress and effort are measured against the plan, deviations are assessed, and dates, capacity or scope are adjusted accordingly. Project planning sets the structure once, up front – project control keeps it valid across the entire run time. Without control, a plan is only a snapshot.
The distinction matters in practice: plan only, and after kick-off you have a document. Control, and you need continuous feedback from execution – progress per task, hours booked, dates moved. In machinery and plant engineering, that feedback loop is what decides whether a promised delivery date holds or is only flagged as at risk four weeks too late. What control actually means during execution — which control variables exist and when to intervene — is covered on the project control page.
Components
What belongs in a project plan?
Project planning is more than a schedule. Six components have to fit together before a promised date becomes a plan anyone can rely on.
The first five points are planning, the sixth is already control. This seam is where it is decided whether a plan survives daily operations or ends up filed away after four weeks.
An honest boundary
What Linetrack does not do
Linetrack is not an ERP system and not a time tracking system. It plans and controls projects – it does not invoice them. There is no item master data, no bills of material, no invoicing and no payroll. If you need one of those functions, you need an ERP, not Linetrack.
Actual hours are not captured in Linetrack either. They arrive through an interface from the system where hours are booked anyway: 50% of customers with a live connection import their actual hours for the planned-versus-actual comparison, and every one of them imports staff absences from time tracking or HR.
That is deliberate. A project control system that brings its own time tracking competes with the system HR and the works council already run – and loses. Which systems are connected and how the data flows is documented under integrations.
What Linetrack does deliver is the layer in between: the shared planning and control level where project management, departments and the executive board all look at the same numbers. Fragmented planning becomes complete project and portfolio transparency.

Step 1 – Plan
Planning: structure, dates and capacity in one pass
Planning starts with the work breakdown structure: phases, sub-projects, work packages. Underneath sit the tasks, with duration, dependencies and the department that executes them. Because a task and its resource are the same object in Linetrack, the plan immediately checks whether the planned hours fit into available capacity – across all projects, not just within its own plan.
How dates and capacity come together natively is covered in detail under scheduling and capacity planning. As soon as several projects compete for the same design engineers, electrical planners and fitters, single-project planning effectively becomes multi-project management – even when only one project is being planned at that moment.
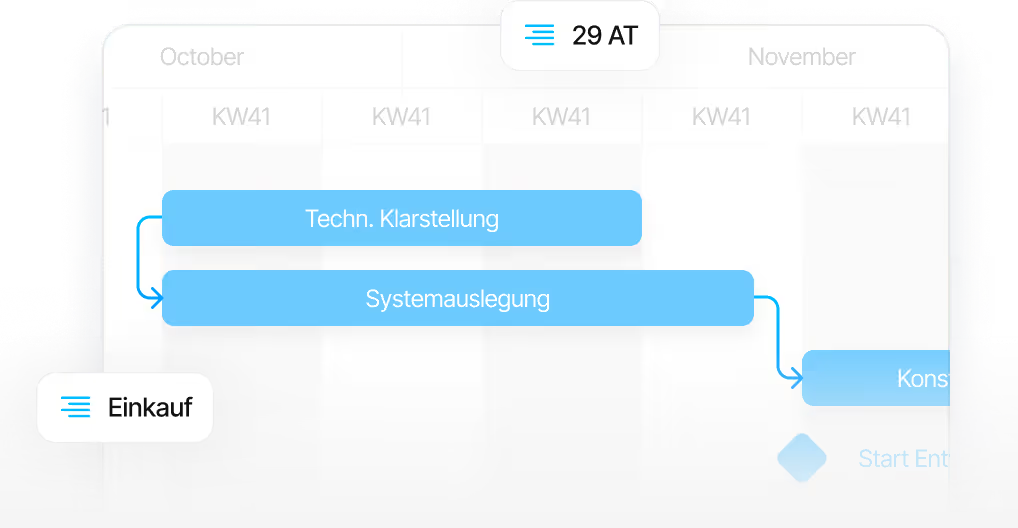
This page describes the method: the terms, the closed loop and how the planning levels interact. If you would rather see the concrete features of the planning module – views, handling, demo – they are on the product page project planning.
Step 2 – Control
Control: measure, assess, adjust
Once the project is running, the plan becomes the yardstick. Employees report progress through task tracking, on the desktop or on mobile out on site; actual hours arrive through an interface from the time tracking system. Together they produce a continuous comparison between what was planned and what actually happened.
Two topics go deeper on this step. The Gantt chart explains how tasks, dependencies and milestones are visualised – and why a Gantt chart with a capacity histogram underneath it is something quite different from a plain bar chart. The planned-versus-actual comparison shows how planned and actual hours are set against each other per task, which metrics come out of it, and at what level of deviation a response is due.
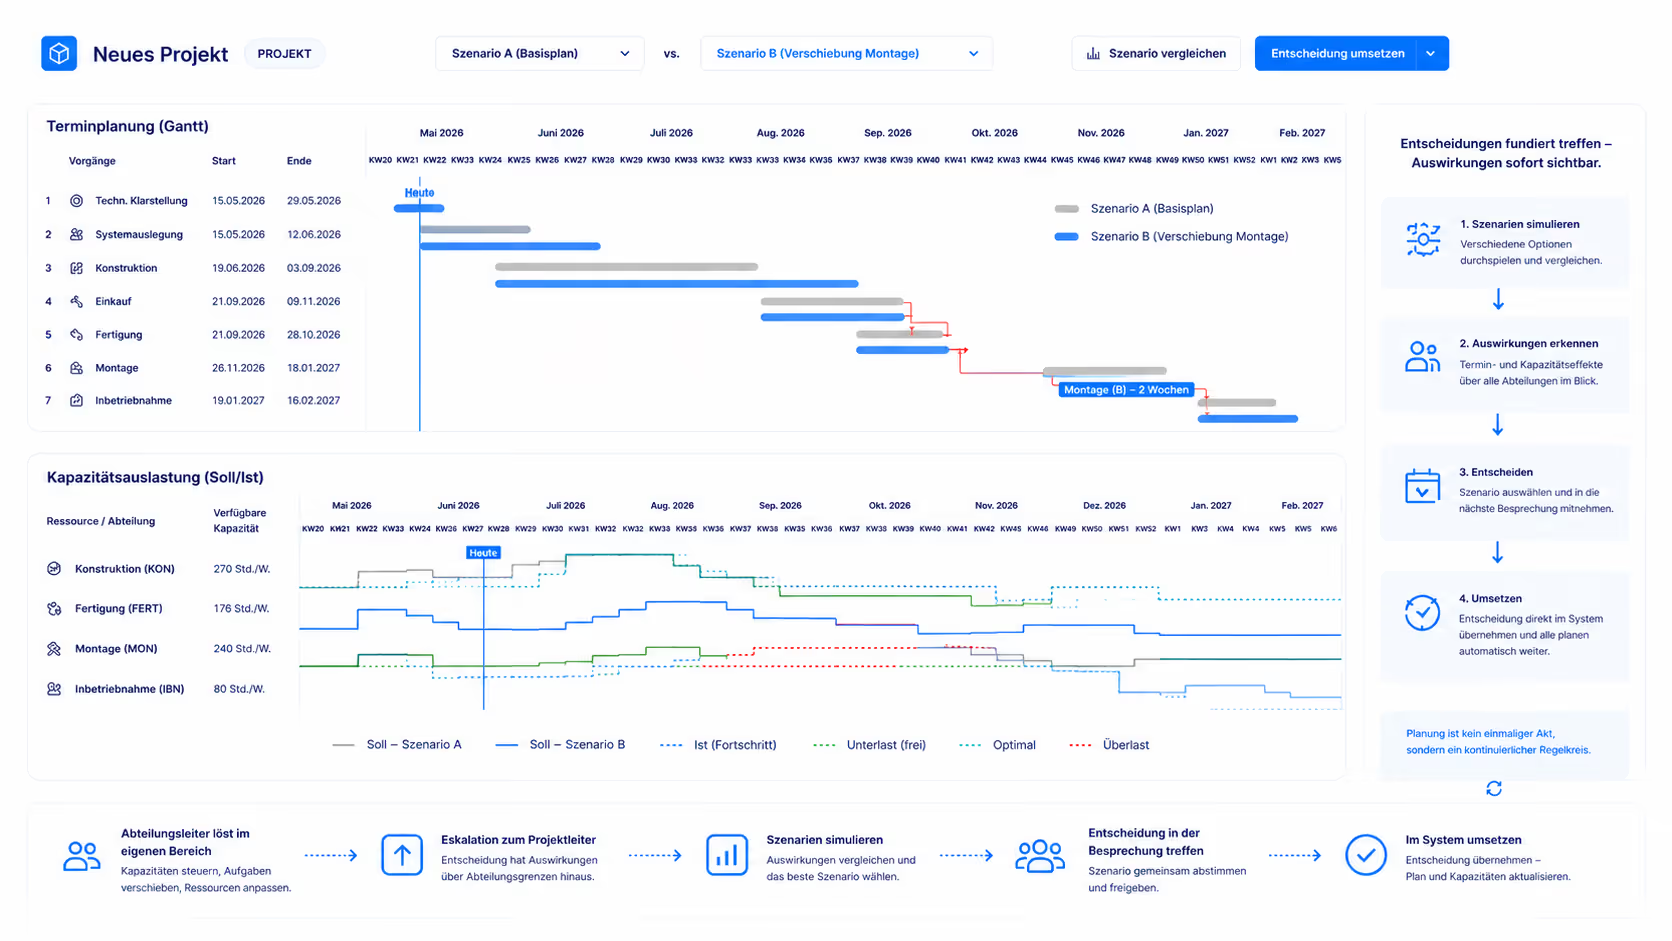
In Linetrack, adjusting does not mean pushing out the end date and carrying on. The project manager simulates the alternatives – extend a task, add capacity, outsource a work package, reorder the sequence – and sees what each variant means for the other projects in the portfolio before deciding. Only then is the decision made and the plan updated.
The closed loop
Plan, execute, measure, adjust
Project planning and project control are not a sequence but a loop. Every cycle produces the data foundation for the next one – which is why control ends in a new plan, not in a post-mortem calculation.
A weekly cadence works well, and a daily one during assembly and commissioning. What matters is not the frequency but that every cycle builds on the same data instead of a freshly assembled status report.
Case Study
From status report to continuous control
Before Linetrack, the project status was assembled from individual reports and spreadsheet versions, pulled together only in the meeting itself. Today planning, feedback and planned-versus-actual run on one data foundation – the status meeting assesses deviations instead of first having to collect them.
„With Linetrack, we've eliminated countless opaque plans."


FAQ
Frequently asked questions
Still have questions?
Book a meeting with our team.
What is the difference between project planning and project control?
What is the difference between project planning and project control?
What belongs in a project plan?
What belongs in a project plan?
What is project controlling?
What is project controlling?
How does project monitoring work while a project is running?
How does project monitoring work while a project is running?
Which software is right for project planning in industry?
Which software is right for project planning in industry?
What does project planning and control software cost?
What does project planning and control software cost?
Do you need an ERP system for project control?
Do you need an ERP system for project control?
How long does it take to roll out Linetrack?
How long does it take to roll out Linetrack?
Learn more
Linetrack in detail
The modules behind project planning and project control: