Control while work is running
Project control:
when you intervene, and with what

In short
Project control is the intervening half of project management: it keeps the plan valid during execution by judging deviations and adjusting four control variables – dates, capacity, scope and sequence. A decision is due as soon as a deviation consumes a task's buffer or reaches a downstream task. Linetrack calculates beforehand what each option means for the remaining projects – in use at Stadler Rail and Schnaithmann Maschinenbau, among others.


















1512
industrial projects run
in parallel
270+
parallel projects at
the largest customer
59 %
named manual status chasing
as a starting problem
10 WD
from kick-off
to go-live
Every figure on this page comes from a full survey of all live Linetrack implementations, as of August 2026. Multiple answers were possible for the starting problems.
Definition
What project control means in a running project
Project control has three parts that follow one another. The actual state of each task is measured: reported progress, booked hours, real dates. The gap to the plan is judged – because not every deviation calls for a decision. An intervention only follows when the judgement says the task will not recover on its own. Drop any one of the three parts and you get either action on suspicion or a report that leads nowhere.
This page deals with the intervening part. How planning and control connect as one loop, and what belongs in a complete plan, is covered under project planning and control; which metrics the measurement produces, and where the actuals come from, is covered by the plan-versus-actual comparison. In machinery and plant engineering this is where a promised delivery date is won or lost: the same design engineers, electrical planners and fitters work across several projects at once, so every intervention in one project moves work in the others.
Control variables
The control variables of a running project
Plenty gets measured, little can actually be moved. A running task has four variables you can turn – and each of them is paid for by another part of the project.
What is measured and what can be moved are not the same thing. Percent complete, remaining effort and schedule adherence are measurements: they show the state but cannot be changed directly. Anyone trying to steer percent complete instead of adjusting dates, capacity, scope or sequence is correcting the display rather than the cause.
Decision threshold
The deviation at which you intervene
Not every delay is a control case. A task running two days late with three days of buffer often catches up by itself; intervening there spends capacity on a problem that was none. Intervening too late is paid for with the delivery date. The threshold in between can be stated – and it is not a percentage, but a combination of three criteria.
The three criteria apply independently of one another. First, the buffer: as long as the deviation is smaller than the task's reserve, it stays inside the corridor and is watched, not treated. Second, the trend: a single report can be a data-entry error or a shifted day of leave – a deviation only becomes reliable once two consecutive reporting dates point the same way. Third, contact: as soon as a deviation reaches a milestone or a downstream task, the decision is made immediately, regardless of buffer and trend. How much buffer a task holds and whether it sits on the critical path can be read off the bar chart – see the page on the Gantt chart.
For the second criterion to be measurable at all, you need fixed reporting dates. A trend across two data points only exists if both were measured by the same rules and at the same interval. A status collected once on a Monday and next on a Thursday produces a curve made of collection differences rather than project reality – and the threshold then fires either too early or not at all. The control rhythm is therefore not a formality but the condition under which the rule remains applicable.
Interventions
The interventions available to you
Five interventions cover the repertoire. The interesting part is not the list but the third column: each intervention is paid for with a different variable, and which one it is decides whether it is bearable in the situation at hand.
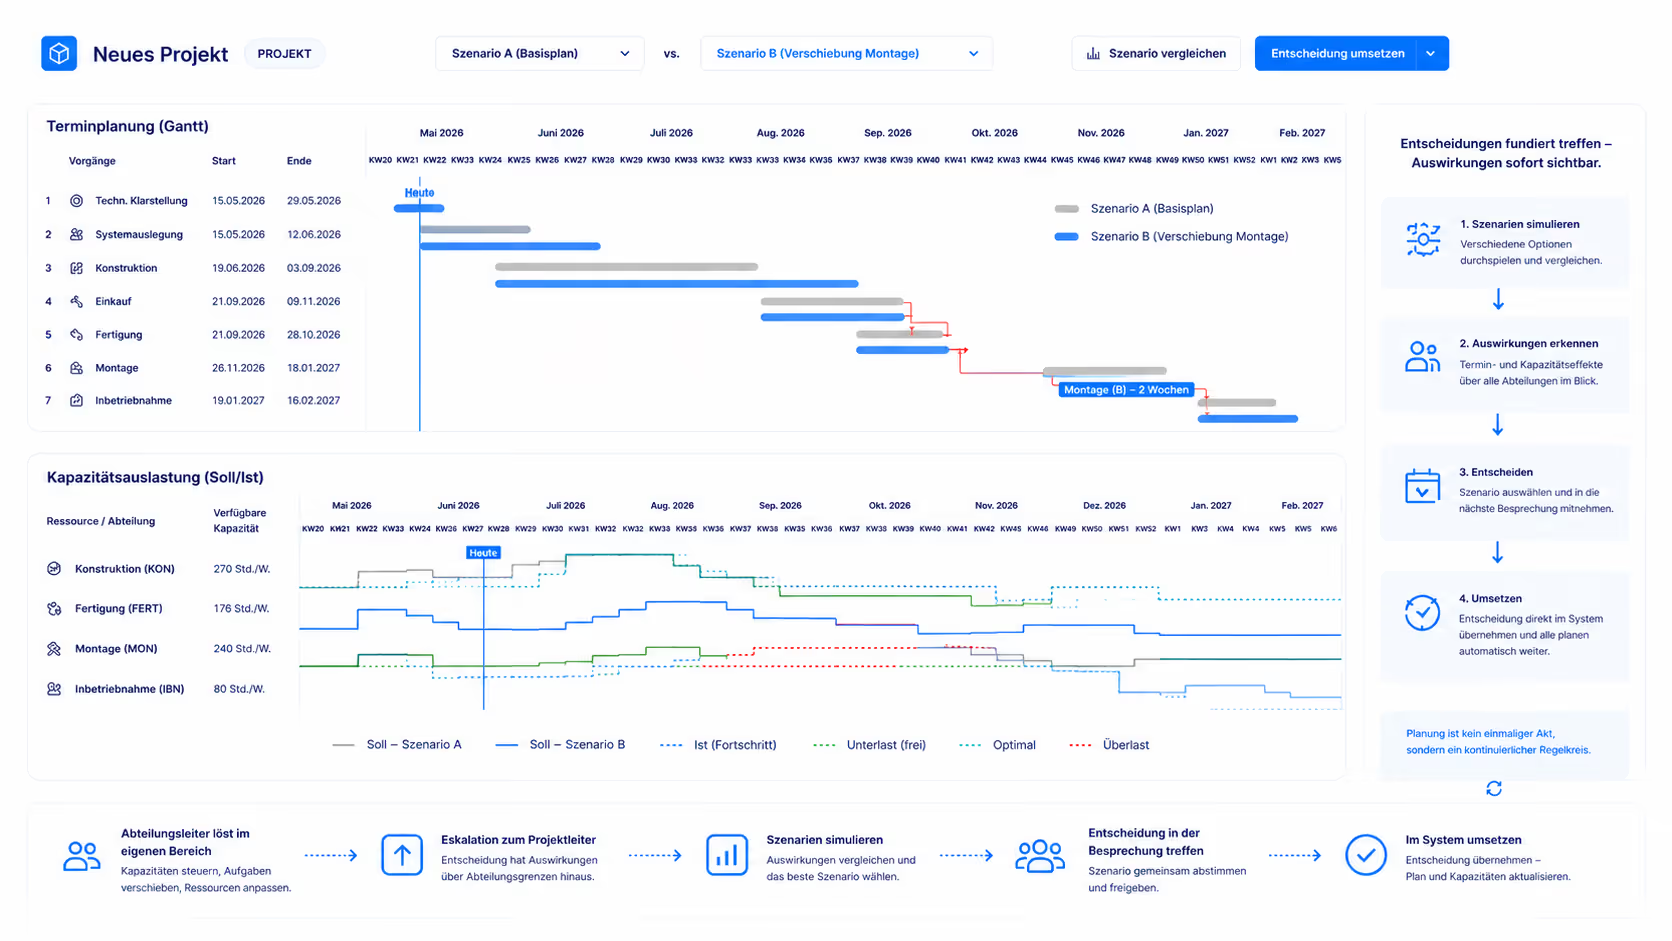
All five interventions reach beyond the project itself as soon as departments are shared across projects. That is why Linetrack calculates before the decision rather than after it: the option is simulated, its effect appears as a spike in the capacity histogram of the affected department, and only the chosen option goes back into the plan. What an intervention means for the remaining projects is covered by multi-project management.
Roles and escalation
Who decides the intervention
An intervention is a decision, and decisions sit with roles. The project manager owns milestones, phases and the targets per department. The department head plans within those targets and solves whatever his area allows – he cannot move the targets themselves. Team members report progress on their own tasks and change no dates; where that actual state comes from is covered by task management.
Whatever the department head cannot solve within his area escalates to the project manager – visibly, not as a quiet correction to his own plan. The project manager then sees what the options mean for the other departments, plays the scenarios through, and takes the calculated options into the next meeting. How dates and capacity come together on one data foundation for this is covered under scheduling and capacity planning.
An honest boundary
What Linetrack does not do
Linetrack does not clear an overload by itself. The system shows that a department is above its capacity, calculates the dependencies through and quantifies what the options cost. Which one is carried out is decided by the project manager. There is no automation that moves tasks on its own – and that is deliberate: an automatic replan nobody ordered gets reversed in the next meeting.
Linetrack is neither an ERP nor a time-tracking system. Actual hours are booked where they are booked anyway and arrive through an interface; master data, purchasing and invoicing stay in the ERP. Which systems are connected, and how the data flows, is covered under integrations.
No claims management, no forensic delay analysis. Linetrack documents when which status was reported and marks the critical path. The retrospective delay and variation analysis required for a contractual claim is not part of it – anyone who needs that needs a separate process for it.
And project control is not project controlling. Controlling measures and puts plan against actual; control decides what happens next. Linetrack supplies the figures for that decision, not the verdict.

FAQ
Frequently asked questions
Still have questions?
Book a slot with our team.
What is project control?
What is project control?
What are the tasks of project control in a running project?
What are the tasks of project control in a running project?
Which control variables can a project manager change?
Which control variables can a project manager change?
At what level of deviation should you intervene in a project?
At what level of deviation should you intervene in a project?
What is the difference between project control and project management?
What is the difference between project control and project management?
Who decides an intervention – the system or the project manager?
Who decides an intervention – the system or the project manager?
What does a system need in order to calculate an intervention before the decision?
What does a system need in order to calculate an intervention before the decision?
Learn more
Linetrack in detail
The modules behind measuring, judging and intervening: